

Mastering Uncertainty: Standard Deviation in Demand Forecasting
Table of Contents
1. Executive Summary
Definition and core value. Standard deviation ($\sigma$) is the statistical measure of market volatility—the indispensable variability metric that transforms raw demand data into actionable inventory strategy. While average demand tells you what to stock, standard deviation tells you how much buffer you need to survive reality. For European SMEs navigating diverse markets and erratic supply chains, mastering this metric is the difference between costly stockouts and optimized 98% service levels.
2. The Friction (The Problem)
Why this is hard. Most logistics managers forecast based on averages (Mean), assuming demand will behave "normally." It rarely does. Averages hide the chaos of peaks and valleys. Relying on them leads to the "flaw of averages": you will be overstocked during quiet periods (tying up capital) and stocked out during spikes (losing revenue). This erratic behavior amplifies upstream, causing the Bullwhip Effect, where small consumer fluctuations create massive disruptions for suppliers. Without measuring variability, you are effectively driving blind.

Figure 2: Without understanding variability (standard deviation), small demand fluctuations amplify into costly disruptions upstream—a phenomenon known as the Bullwhip Effect.
3. Theoretical Background
The Mechanics. Standard deviation measures the dispersion of a dataset relative to its mean. In logistics, it quantifies the "spread" of your demand. * Low $\sigma$: Demand is consistent and predictable (e.g., milk, bread). * High $\sigma$: Demand is volatile and erratic (e.g., fashion, electronics).
Mathematically, for a set of demand values, it is calculated as the square root of the variance. In a Normal Distribution (Bell Curve), 68% of demand falls within $\pm1\sigma$, and 95% falls within $\pm2\sigma$. This probability distribution is the foundation for calculating Safety Stock.
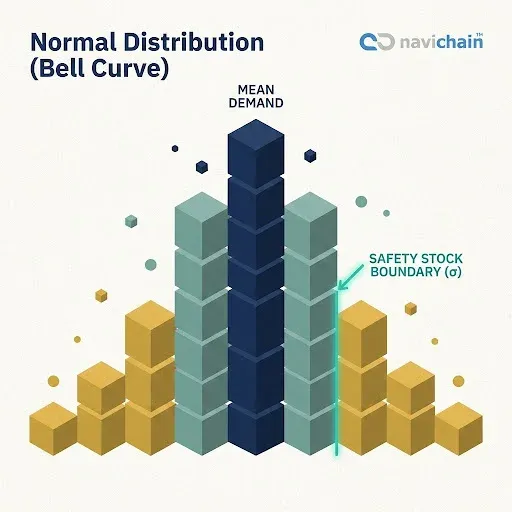
Figure 3: The Normal Distribution curve visualizes demand variability. The spread of the curve, measured by standard deviation, dictates the necessary safety stock buffer.
4. The Data Evidence
Why this matters physically. Averages lie; variance reveals the truth. Consider two products with the same average demand of 100 units/week: * Product A: Sells 90-110 units ($\sigma \approx 5$). Easy to manage. * Product B: Sells 0-200 units ($\sigma \approx 70$). a nightmare to manage.
Stocking 110 units works for Product A but guarantees failure for Product B. Data shows that companies ignoring standard deviation in safety stock calculations suffer 30-40% higher inventory costs to maintain the same service level as competitors using statistical methods.

Figure 4: Using standard deviation to create upper and lower bounds allows businesses to absorb demand spikes without stocking out or overstocking.
5. Strategic Application

How to implement. The primary application of standard deviation is calculating Safety Stock ($SS$) to buffer against uncertainty. The standard formula is:
$$Safety Stock = Z \times \sigma_{LT}$$
Where: * $Z$: The Z-score corresponding to your desired Service Level (e.g., 1.65 for 95%, 2.33 for 99%). * $\sigma_{LT}$: Standard deviation of demand during lead time.
Implementation Steps: 1. Clean Your Data: Remove outliers (promotions, one-off events) that skew $\sigma$. 2. Calculate $\sigma$: Use rolling periods (e.g., last 12 weeks) to capture current volatility. 3. Set Service Levels: High margin items get higher Z-scores (98%+); low margin items get lower ones. 4. Automate: Static spreadsheets fail because $\sigma$ changes. Use dynamic tools.

Figure 5: By mastering standard deviation, companies achieve the perfect balance of inventory—minimizing capital tied up in stock while maximizing service levels.
6. The Navichain Perspective: Real-Time Calculation
Automated precision. In the modern supply chain, demand volatility shifts daily. navichain treats standard deviation not as a static number, but as a dynamic signal. Our platform continuously recalculates $\sigma$ based on real-time transactional data, automatically adjusting safety stock levels and reorder points. This ensures your capital is deployed efficiently—protecting service levels during volatility and reducing inventory when the market stabilizes—all while ensuring Data Sovereignty by keeping your sensitive demand data secure within your control.

Figure 6: navichain automates the complex calculation of standard deviation in real-time, ensuring your safety stock levels adapt instantly to changing market conditions.
7. Real-World Success Stories
Case Case Studies. * The Little Potato Company: By moving from average-based forecasting to statistical safety stock modeling (using standard deviation), they improved their inventory fill rate from 90.9% to 98%, significantly boosting customer satisfaction while optimizing stock levels. Source * Top 10 Global Retailer: A major retailer implemented machine learning models that accounted for demand variability ($\sigma$) in seasonal products. This reduced forecast error and lowered inventory costs for seasonal goods by 6%, proving that understanding variance directly impacts the bottom line. Source * Pharma Distributor: Faced with erratic demand (high $\sigma$), a distributor used advanced forecasting to capture variability patterns. This resulted in a 40% reduction in excess inventory and a 25% reduction in forecast error, balancing critical availability with cost efficiency. Source
8. Strategic Takeaway
Conclusion. Standard deviation is the lens through which successful supply chain leaders view the future. It transforms uncertainty from a risk into a calculated variable. By shifting from average-based planning to variability-based planning, European SMEs can achieve the "impossible" trinity: lower inventory, higher service levels, and reduced expediting costs. In a volatile world, the mean is meaningless; variance is value.
9. References
Verified links. * Netstock. (2023). Safety Stock Formula & Calculation: The Ultimate Guide. View Guide * Tredence. (2022). Enhancing Forecast Accuracy for a Top 10 Retailer. Read Case Study * Institute of Supply Chain Management (IoSCM). The Role of Standard Deviation in Inventory Management. View Article * Association for Supply Chain Management (ASCM). Understanding Safety Stock and Service Levels. View Resource
navichain Insights Newsletter
Join the newsletter to receive the latest updates in your inbox.


