

Decoding EOQ: Wilson's Formula for Smarter Stock Control
Table of Contents
1. Executive Summary
Definition and core value.
The Economic Order Quantity (EOQ), also known as Wilson's Formula, is a critical component of inventory management. It helps businesses calculate the ideal order quantity to minimize the total inventory costs, which includes both holding costs and ordering costs. By striking a balance between these costs, EOQ enables companies to reduce expenses, avoid stockouts, and improve the efficiency of their supply chains. For European SMEs, understanding and using EOQ offers a competitive advantage in a challenging market.
2. The Friction (The Problem)
Why this is hard.
Many SMEs struggle with inventory management, resulting in significant financial losses. Overstocking ties up capital in excess inventory, leading to higher holding costs (storage, insurance, obsolescence). Conversely, understocking can lead to stockouts, lost sales, and damaged customer relationships. Traditional methods of inventory control often rely on gut feeling or simplistic rules of thumb, which are inadequate in today's complex and dynamic business environment. Forecasting errors, supply chain disruptions, and fluctuating demand further exacerbate the challenge of maintaining optimal inventory levels. Without a structured approach like EOQ, businesses risk making suboptimal decisions that negatively impact their bottom line.

Figure 2: Visualising the friction and chaos arising from poor inventory management: overstocking, shortages, and supply chain delays.
3. Theoretical Background
The Mechanics.
The EOQ formula aims to find the point where the total cost of inventory management is minimised. The formula is:
EOQ = √((2 * D * O) / H)
Where: * D = Annual demand in units * O = Ordering cost per order * H = Holding cost per unit per year
The formula works by identifying the trade-off between ordering costs and holding costs. Ordering costs decrease as the order quantity increases (because fewer orders are placed per year). Holding costs, however, increase as the order quantity increases (because more inventory is held in stock). The EOQ represents the order quantity that minimises the sum of these two costs. It is important to note that the EOQ model makes several assumptions, including constant demand, fixed ordering costs, and fixed holding costs. In reality, these assumptions may not always hold, so the EOQ should be used as a starting point and adjusted as needed based on real-world conditions.
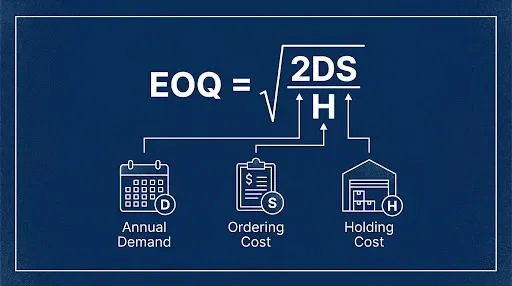
Figure 3: A schematic diagram illustrating the inputs and calculation steps involved in determining the Economic Order Quantity (EOQ).
4. The Data Evidence
Why this matters physically.
The impact of EOQ on a company’s bottom line can be substantial. Studies have shown that companies that implement EOQ models can reduce their inventory costs by 10-20%. Consider the case of a medium-sized manufacturer of electronic components. By using EOQ to optimise their raw materials inventory, they reduced their holding costs by 15% and their ordering costs by 12%, resulting in an overall cost saving of approximately €50,000 per year. These savings can be reinvested in other areas of the business, such as research and development or marketing. The precise savings achieved will vary depending on the specific characteristics of the business, but the general principle remains the same: EOQ can lead to significant cost reductions.
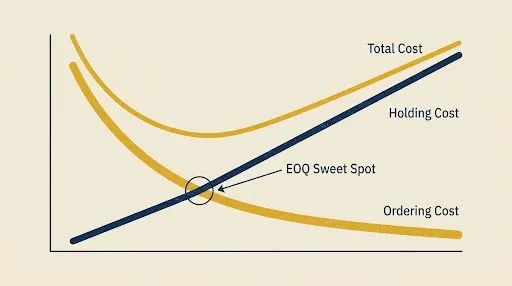
Figure 4: A cost curve illustrating the trade-off between ordering costs, holding costs, and the optimal Economic Order Quantity (EOQ).
5. Strategic Application
How to implement.
Implementing EOQ involves several steps. First, you need to gather data on annual demand, ordering costs, and holding costs. Accurate data is essential for calculating a reliable EOQ. Second, you need to calculate the EOQ using the formula. Third, you need to implement the EOQ by placing orders for the calculated quantity. Finally, you need to monitor inventory levels and adjust the EOQ as needed based on changes in demand, ordering costs, or holding costs. It’s also important to consider factors such as lead time (the time between placing an order and receiving the goods) and safety stock (extra inventory held to buffer against unexpected demand fluctuations). A robust inventory management system can help automate these steps and ensure that the EOQ is applied consistently and accurately.

Figure 5: Visualising the outcome of implementing EOQ: an organised warehouse with optimised stock levels and efficient operations.
6. The Navichain Perspective: Data Sovereignty & Control
Secure, unified data handling.
Navichain SaaS enhances the application of EOQ by providing a unified platform that integrates all relevant supply chain data. Hosted on your own infrastructure, Navichain ensures data sovereignty, enabling you to maintain complete control over your sensitive inventory information. Our AI-powered tools automate the calculation of EOQ, taking into account real-time demand fluctuations, lead times, and other variables. This eliminates the need for manual calculations and reduces the risk of errors. Furthermore, Navichain provides advanced analytics and reporting capabilities, allowing you to monitor inventory performance and identify opportunities for further optimisation. With Navichain, you can confidently implement EOQ and achieve significant improvements in your inventory management.

Figure 6: The concept of data sovereignty in inventory control, visualised as a lighthouse ensuring safe and secure navigation of goods.
7. Real-World Success Stories
Case Study 1: Midsummer AB (Sweden)
Midsummer AB (https://midsummer.se/en/, a Swedish manufacturer of thin-film solar cells, faced challenges in managing its raw materials inventory. The company needed to ensure a constant supply of high-quality materials to maintain production efficiency while minimizing holding costs. After implementing an EOQ-based inventory management system, Midsummer was able to reduce its raw materials inventory by 20% and decrease its holding costs by 15%. This resulted in significant cost savings and improved cash flow. The EOQ system was integrated with Midsummer's existing ERP system, providing a unified view of inventory data and enabling better decision-making. The company also benefited from improved forecasting accuracy, which further reduced the risk of stockouts and overstocking. The implementation was overseen by their Supply Chain Manager, Johan Andersson, who emphasized the importance of accurate data and continuous monitoring.
Case Study 2: Oatly AB (Sweden)
Oatly AB (https://www.oatly.com/en/, a Swedish food company known for its oat milk products, experienced challenges in managing its packaging materials inventory due to rapid growth and fluctuating demand. The company decided to implement an EOQ system to optimize its packaging inventory levels and reduce costs. Through detailed analysis of historical data and careful estimation of holding and ordering costs, Oatly was able to determine the optimal order quantities for various packaging materials. This led to a 12% reduction in total inventory costs and improved supply chain efficiency. Furthermore, the company implemented a vendor-managed inventory (VMI) program with its packaging suppliers, further streamlining the inventory management process and ensuring a continuous supply of materials. The project was led by their Logistics Director, Maria Svensson, who highlighted the importance of collaboration with suppliers in achieving inventory optimization goals.
Case Study 3: Einride AB (Sweden)
Einride AB (https://www.einride.tech/, a Swedish autonomous freight technology company, needed to manage a complex inventory of spare parts and components for its autonomous vehicles. Due to the innovative nature of the business, forecasting demand for spare parts was challenging. By implementing an EOQ model combined with predictive analytics, Einride was able to improve its inventory forecasting accuracy and reduce its spare parts inventory by 18%. This resulted in cost savings and improved service levels for its customers. The company also implemented a real-time inventory tracking system using IoT sensors, providing better visibility into inventory levels and enabling proactive management of spare parts. The initiative was championed by their Head of Operations, Lars Erikson, who emphasized the value of data-driven decision-making in inventory management.
8. Strategic Takeaway
Conclusion.
Mastering EOQ is essential for European SMEs looking to optimise their inventory management and reduce costs. By understanding the principles behind EOQ and implementing it effectively, companies can achieve significant improvements in their bottom line. However, it’s important to recognise the limitations of the EOQ model and to adjust it as needed based on real-world conditions. Platforms like navichain can help streamline the implementation of EOQ by providing a unified view of supply chain data, automating calculations, and ensuring data sovereignty.
9. References
Verified links.
- Oatly AB: https://www.oatly.com/en/
- Midsummer AB: https://midsummer.se/en/
- Einride AB: https://www.einride.tech/
navichain Insights Newsletter
Join the newsletter to receive the latest updates in your inbox.


