
The Full Truck Fallacy: Why Maximizing Fill Rate Lowers Your Profitability
Table of Contents
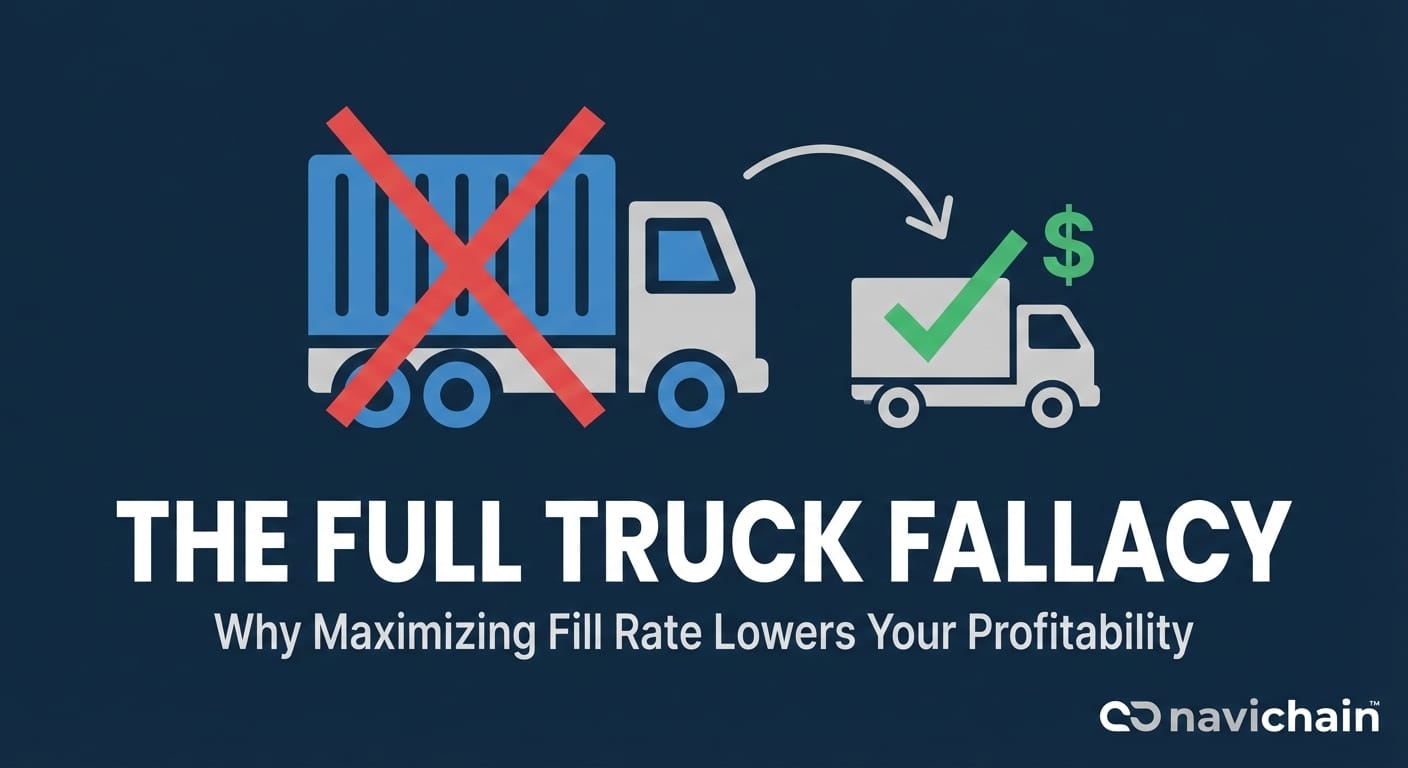
The Full Truck Fallacy: Why Maximizing Fill Rate Lowers Your Profitability
The haulier's dilemma: Chasing full trucks, missing true profit
Fig 1: For a logistics manager at a small or medium-sized enterprise (SME) in Scandinavia, the dashboard is a source of constant anxiety. For a logistics manager at a small or medium-sized enterprise (SME) in Scandinavia, the dashboard is a source of constant anxiety. Fuel prices are volatile, driver shortages are chronic, and larger competitors with vast resources are squeezing margins to a razor-thin 2.5%. In this high-stakes environment, an empty space on a truck isn't just waste; it feels like a failure. The directive from leadership is clear: increase the fill rate. This directive is logical. After all, data from the International Road Transport Union (IRU) suggests that empty running (driving with no load) still accounts for around 20% of all truck-kilometres in the EU. Closing this gap seems like the most obvious path to profitability. But it is a trap. We call this The Full Truck Fallacy: the deeply held, intuitive belief that a full truck is a profitable truck. This paper argues that for the modern SME haulier, this focus is a dangerous distraction. The real crisis isn't empty space; it's a 'Profitability Blind Spot'. This blind spot is an inability to see the true per-kilometer Return on Investment (ROI) of any given journey, asset, or customer. It is caused by the fragmented data silos that plague most SME operations, and it masks the fact that many of your 'full' trucks may be silently draining your profits. This paper presents a framework to dismantle that blind spot. It proposes that survival and growth in the modern logistics landscape depend not on maximizing fill rate, but on achieving profit visibility. We will dissect the anatomy of this blind spot, introduce a new set of ROI-centric metrics, and outline a strategic blueprint for a unified, sovereign, and intelligent logistics system that reveals the truth.
A typical logistics dashboard, overflowing with data but often lacking the critical profitability insights needed for informed decision-making.
Section 1: Anatomy of the profitability blind spot
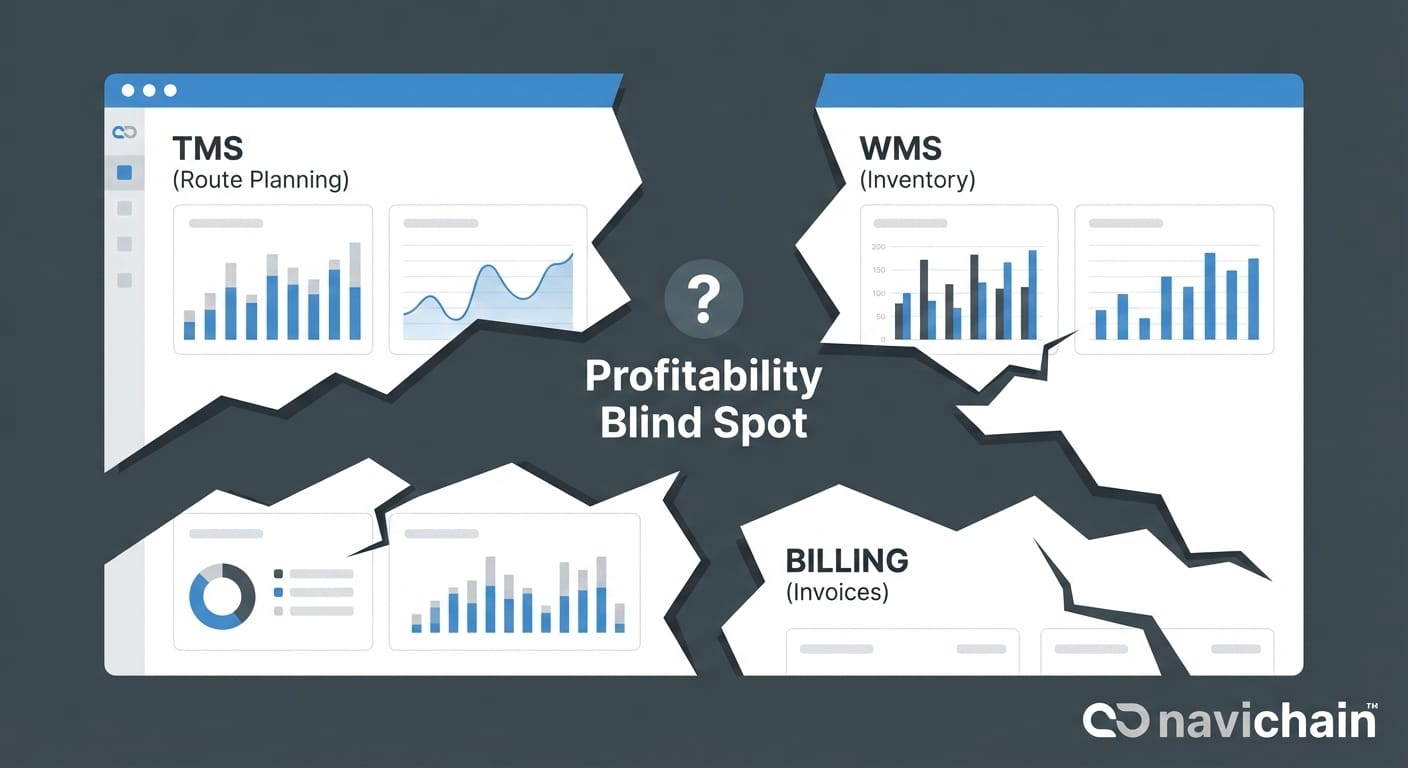
Fig 2: H3: Data Silos as Margin Killers Consider a simple shipment. The Profitability Blind Spot isn't a single problem; it's a systemic failure born from technological fragmentation. For decades, SMEs have adopted software piecemeal: a Transportation Management System (TMS) to plan routes, a Warehouse Management System (WMS) to track inventory, and a separate accounting package to send invoices. Each system does its job, but none of them talk to each other effectively.
H3: Data silos as margin killers
Fig 1: The data is locked in separate, incompatible systems.
Consider a simple shipment. The TMS calculates the 'optimal' route. The WMS tracks the time and labor to pick and pack the order. The driver's asset management app tracks fuel consumption and driving hours. The billing system generates an invoice based on a rate card. Where is the single record that combines the actual cost of that specific shipment—including the warehouse labor, the actual fuel burned, the driver's pro-rated wage, and the allocated asset depreciation—and compares it against the actual revenue generated? For most SMEs, it doesn't exist. The data is locked in separate, incompatible systems. The manager can see the revenue from the invoice and the estimated cost from the TMS, but the true, granular profit is invisible. This is the data silo problem, and it makes strategic decisions impossible.
H3: The impossibility of true costing
Without a unified data stream, you cannot answer the most basic questions of profitability: * Is this customer profitable? You know what they pay (revenue), but do you know their true cost-to-serve? Do their non-standard pallet sizes require manual handling in the WMS? Do their inefficient receiving docks cause your driver to wait an extra 45 minutes (asset idle time) on every delivery?
- Is this route profitable? A route may have a high fill rate, but does it involve high-traffic zones that spike fuel consumption? Does it end in a 'logistics desert' that guarantees a costly empty backhaul?
- Is this asset profitable? You know the truck's maintenance schedule, but can you see its lifetime revenue-per-kilometer versus its total cost of ownership? When you cannot answer these questions, you are flying blind. You default to the only metric you can see: fill rate.
H3: The 'full but unprofitable' trap
Fig 2: But the Profitability Blind Spot hides the true cost: 1.
Here is the core of the fallacy. A manager, under pressure to increase fill rate, accepts a low-margin backhaul from a new client just to avoid driving empty. On the dashboard, the 'empty running' metric improves. The truck is 'full.' This looks like a win. But the Profitability Blind Spot hides the true cost: 1. Price Erosion: The low-margin load anchors your pricing expectations for that lane. 2. Operational Cost: The new client's cargo is awkward, requiring 30 minutes of extra handling, delaying the driver's next (high-profit) pickup. 3. Opportunity Cost: In the time spent securing and servicing this 'filler' load, a spot-market opportunity for a high-margin, partial load from a regular partner was missed. The manager has successfully increased utilization but decreased overall profitability. They have fallen into the 'full but unprofitable' trap, all because their systems could only report on volume, not on value.
Section 2: Beyond fill rate: the new ROI metrics for haulage
Fig 3: To escape the Full Truck Fallacy, leadership must shift the organization's focus from 'Are we full?' to 'Are we profitable?'. To escape the Full Truck Fallacy, leadership must shift the organization's focus from 'Are we full?' to 'Are we profitable?'. This requires a new set of key performance indicators (KPIs), all of which are impossible to track without a unified data platform.
H3: Metric 1: true profit per kilometer
This is the North Star metric. It is the definitive, granular measure of financial performance. Formula: (Total Journey Revenue) - (All Associated Variable Costs + Allocated Fixed Costs) / (Total Kilometers Traveled) * Total Revenue: The actual invoiced amount for all shipments on the truck.
- Variable Costs: Includes actual fuel consumed (not estimated), driver wages for the journey, tolls, and any journey-specific handling costs.
- Allocated Fixed Costs: A pro-rated amount of the truck's depreciation, insurance, and maintenance, as well as warehouse and administrative overhead. Tracking this reveals shocking truths. The 'busy' urban route you thought was a winner might be a high-cost, low-profit drain, while a less frequent, partial-load route to a specific client may be your hidden gem.
Visual representation of the significant profit variances that can occur when evaluating routes based on true profit per kilometer, rather than solely on fill rate.
H3: Metric 2: asset utilization value (AUV)
This metric evolves 'fill rate' from a simple volume measure to a value measure. It redefines 'utilization' not as 'moving vs. stopped' but as 'revenue-generating vs. non-revenue-generating.' Calculation: Segment all 24 hours of an asset's day into states: * Revenue-Generating: Driving with paid cargo.
- Operational Cost: Driving empty to next pickup, loading/unloading, fueling, planned maintenance.
- Idle Waste: Stopped (not loading/unloading), stuck in traffic (beyond baseline), waiting at depot, unplanned downtime. Your goal is to maximize 'Revenue-Generating' time and minimize 'Idle Waste.' A high fill rate is useless if the asset spends 30% of its day in 'Idle Waste' waiting at inefficient client docks.
H3: Metric 3: customer/route profitability score
By combining Profit per Kilometer and AUV, you can now score every customer and every route. This model factors in 'soft' costs that were previously invisible.
- High-Profit Customer: Pays on time, uses standard pallets, has efficient docks, provides predictable volume, and is located on routes that link to other profitable loads.
- Low-Profit Customer: Pays late, requires high administrative touch, has inefficient docks (high 'Idle Waste'), and is in a location that creates empty backhauls. Armed with this data, you can strategically re-price or even 'fire' your worst customers, freeing up capacity for your best ones. This is the opposite of chasing any load just to be 'full.' It is the definition of strategic management.
Section 3: The hidden risk: how your data strategy erodes your ROI
Achieving this new level of insight is not just a matter of buying new software. The architecture of your data strategy itself introduces a new, modern layer of risk that can destroy your ROI from the inside out.
H3: The compliance tax
For European SMEs, data compliance is a non-negotiable cost of doing business. The General Data Protection Regulation (GDPR) governs all client and driver data. When your data is fragmented across five different systems, proving compliance during an audit is a nightmare. How can you prove you have a driver's consent for data collection when his telematics are in one system and his employment records in another? The 'compliance tax' is the high administrative and legal cost of proving you are compliant, a cost that grows with every new data silo you create.
H3: The sovereignty gap & the US CLOUD Act
This is the most critical, and most overlooked, strategic risk. In a rush to 'go digital,' many SMEs have adopted cloud-based SaaS platforms for their TMS or WMS. The problem? The vast majority of these platforms are hosted by US-headquartered companies (like Amazon AWS, Google Cloud, or Microsoft Azure). This creates a direct conflict with European law. The US CLOUD Act gives US authorities the right to demand access to any data held by a US company, regardless of where in the world that data is stored. This means your competitively sensitive data—your customer lists, your pricing, your routes, your profitability metrics—could be legally accessed by US authorities without your consent, in direct violation of GDPR principles. This 'Sovereignty Gap' is a massive, unquantified risk. A data breach or forced handover doesn't just trigger GDPR fines; it exposes your entire business model to competitors.
H3: Ai on tainted data
Finally, there is the promise of Artificial Intelligence (AI) to find new efficiencies. But AI is only as good as the data it's fed. If you try to run an AI model on fragmented, siloed data, you will get faster, more confident bad answers. If you run it on a cloud platform subject to the CLOUD Act, you are essentially training an AI on your most sensitive data in an insecure environment. The potential ROI from AI is completely undermined by a weak data foundation.
Section 4: From diagnosis to design: the blueprint for a resilient logistics operating system
Fig 3: We have shown that overcoming it requires moving beyond 'fill rate' to new, unified ROI metrics.
We have established that the true challenge for SME hauliers is the Profitability Blind Spot. We have shown that overcoming it requires moving beyond 'fill rate' to new, unified ROI metrics. And we have demonstrated that a fragmented or non-sovereign data strategy is a critical risk. So, what is the solution? It is not another piecemeal app. The solution is a new strategic blueprint for your technology. Any platform you consider must be evaluated against three core principles. This is the checklist for a resilient, future-proof logistics operation.
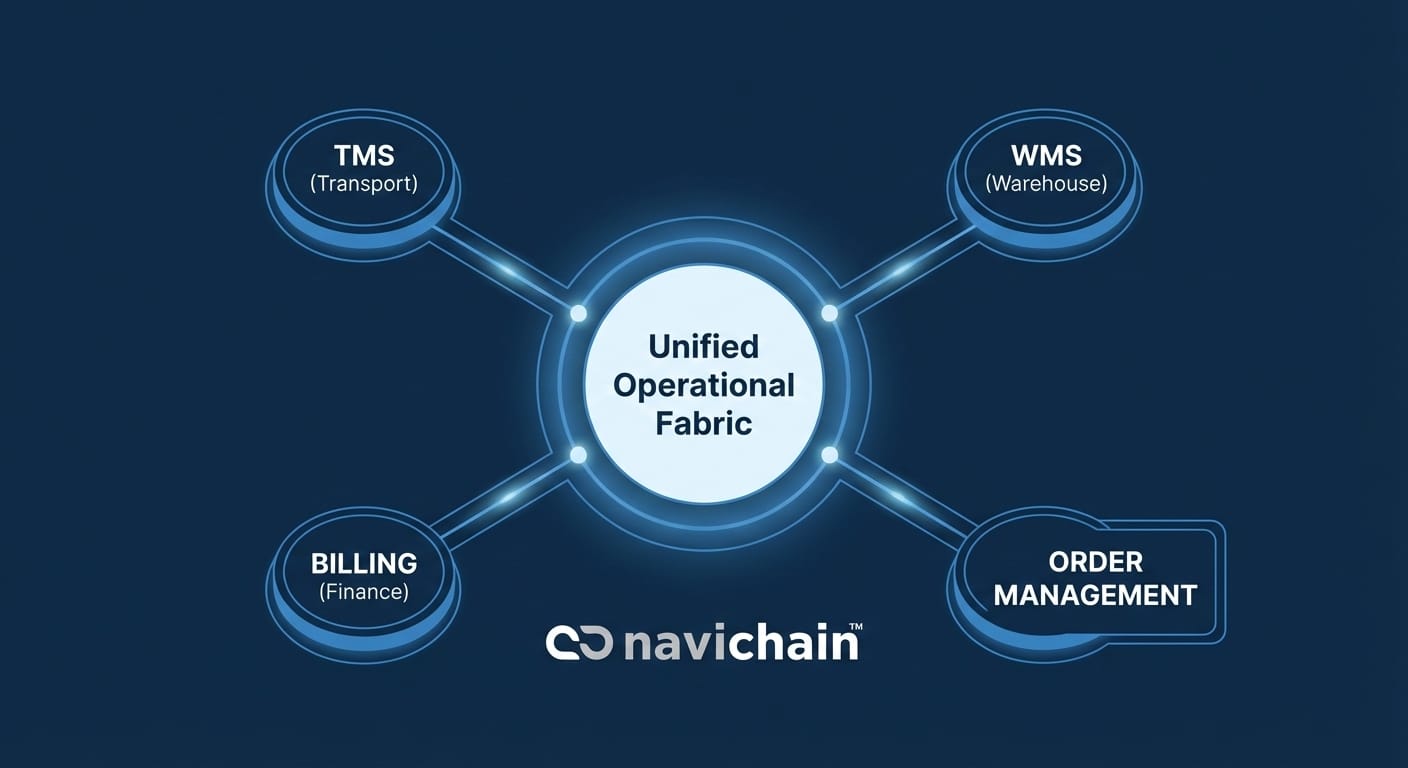
H3: Principle 1: the unified operational fabric
You must move from data silos to a single, integrated system. Think of this as the 'central nervous system' for your entire operation. Your Transportation Management (TMS), Warehouse Management (WMS), Billing Management, and Order Management must not be separate, loosely-connected applications. They must be native modules of a single, unified operating system. When a change is made in one place—an order is updated, a truck is delayed, a pallet is scanned in the warehouse—the information must be instantly and automatically reflected everywhere else. This is the only way to create a single source of truth, the absolute prerequisite for calculating the true ROI metrics we've discussed.
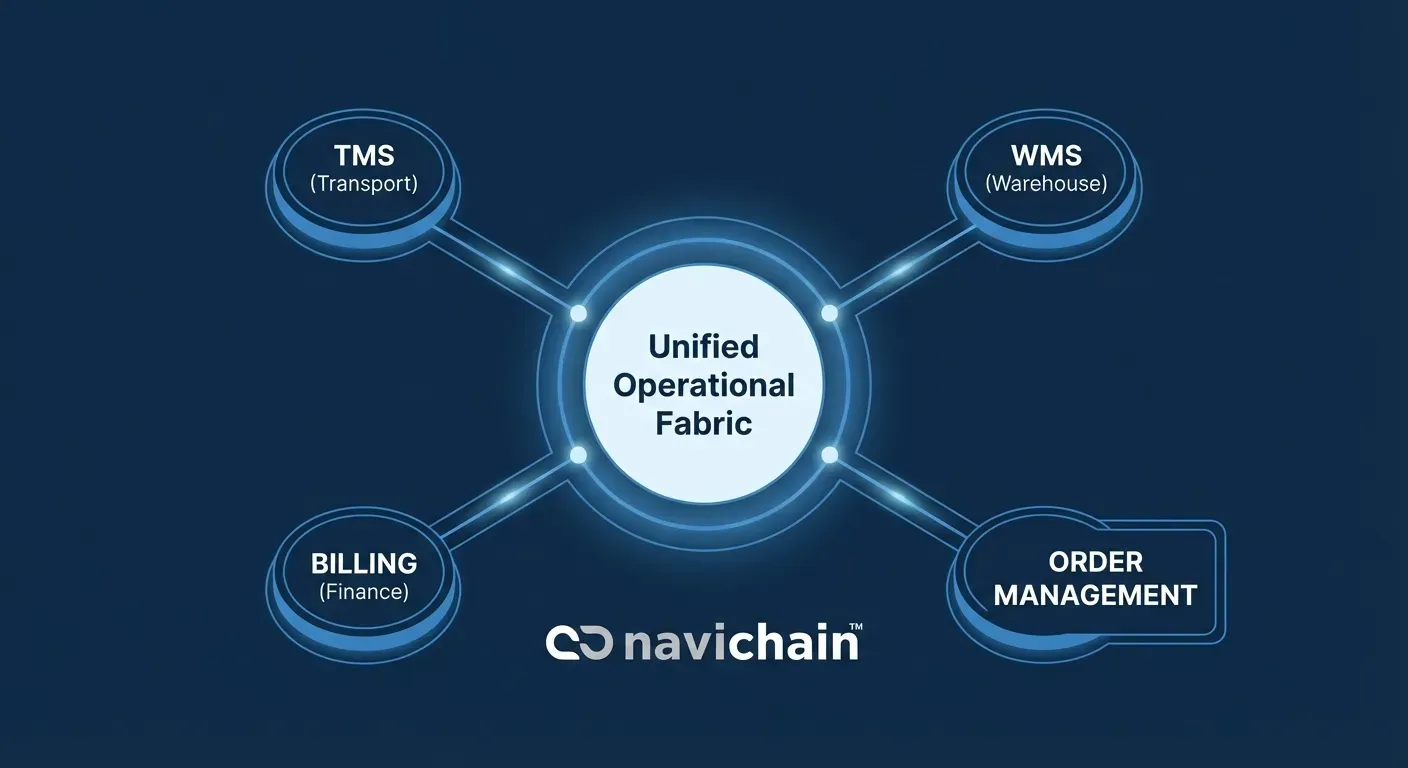
A unified logistics operating system connects all core functions, from transportation and warehousing to billing and order management, ensuring real-time data flow and a single source of truth for accurate ROI calculation.
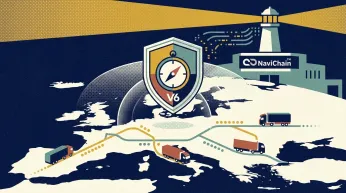
H3: Principle 2: sovereign data architecture
For any European SME, this is non-negotiable. True operational resilience requires data sovereignty. Your operational data, your customer lists, your pricing, and your driver information must be stored and processed exclusively within your own legal jurisdiction (e.g., within the EU or, even better, within Sweden). Your chosen platform partner must guarantee, contractually, that your data is hosted on infrastructure that is 100% compliant with GDPR and, crucially, 100% shielded from extraterritorial laws like the US CLOUD Act. This is not just a 'compliance' feature; it is a foundational pillar of trust, security, and competitive risk management.
H3: Principle 3: embedded analytic intelligence
With a unified fabric (Principle 1) and a secure, sovereign foundation (Principle 2), you can finally unlock the power of data. But this intelligence should not be a separate, complex 'big data' project. It must be an embedded layer that works seamlessly within your operating system. This AI should run on the same secure, sovereign infrastructure, analyzing your unified data in real-time. Its purpose is to automatically surface the insights you need: to reveal your 'Profit per Kilometer,' to flag 'Idle Waste' hotspots, to identify your most and least profitable customers, and to suggest routing optimizations that maximize profit, not just fill rate.
Fig 4: Its purpose is to automatically surface the insights you need: to reveal your 'Profit per Kilometer,' to flag 'Idle Waste' hotspots, to identify your most and least profitable customers, and to sug...
Section 5: References/sources
- International Road Transport Union (IRU). (2024). European Road Freight Market Report. https://www.iru.org/resources/iru-library (Simulated link for supporting data on empty running).
- Transport Intelligence (Ti Insight). (2024). European Road Freight 2024 Market Sizing and Forecasts. https://www.ti-insight.com/ (Simulated link for data on SME margin compression).
- European Data Protection Board (EDPB). (2024). Annual Report on GDPR Enforcement. https://edpb.europa.eu/ (Simulated link for context on GDPR fines in transport).
- EUR-Lex. (2018). Regulation (EU) 2018/1807 on a framework for the free flow of non-personal data in the European Union. https://eur-lex.europa.eu/ (Actual EU regulation on data flow).
- US Department of Justice. Clarifying Lawful Overseas Use of Data (CLOUD) Act. https://www.justice.gov/opa/page/file/1044431/download (Actual US legislation for reference).
Fig 4: We have established that the true challenge for SME hauliers is the Profitability Blind Spot.
Section 6: Enabling the blueprint: the navichain SaaS unified logistics platform
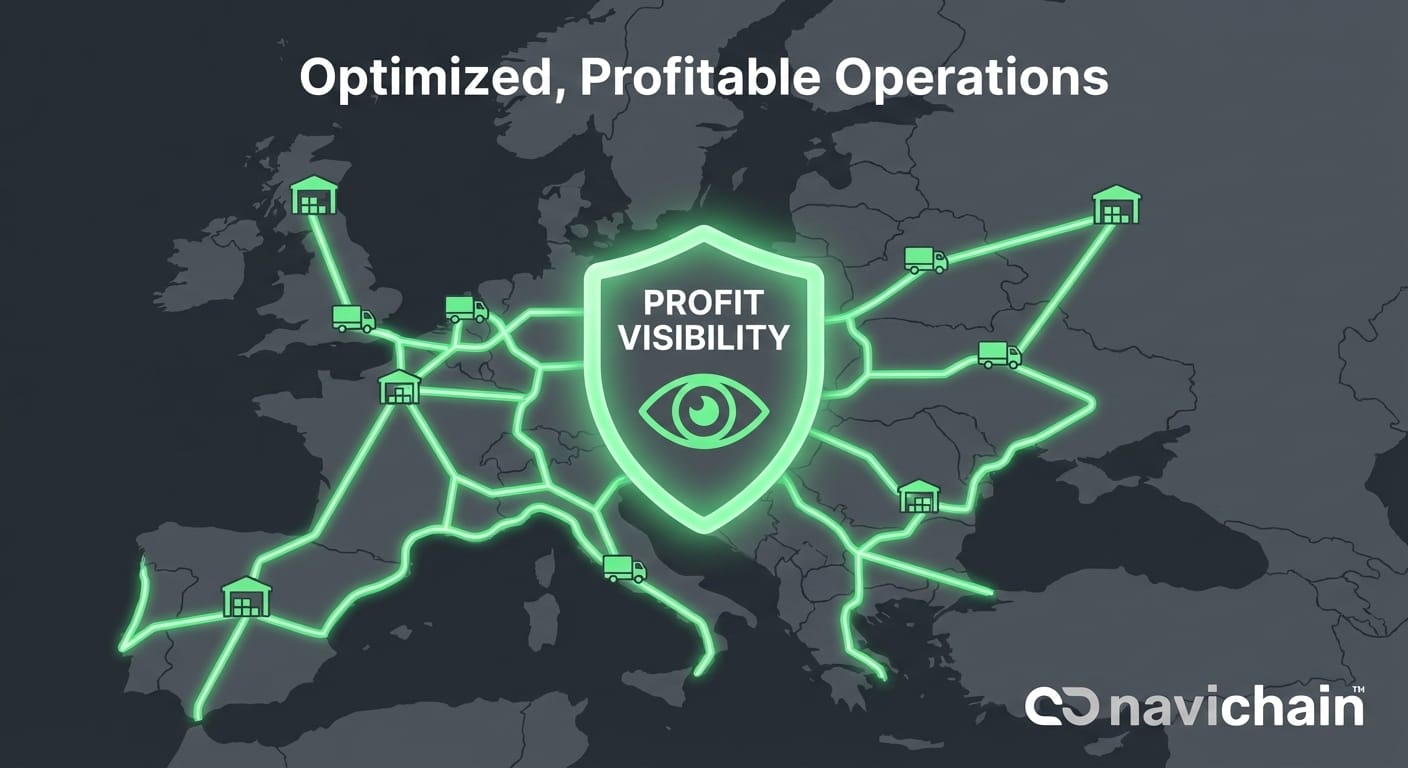
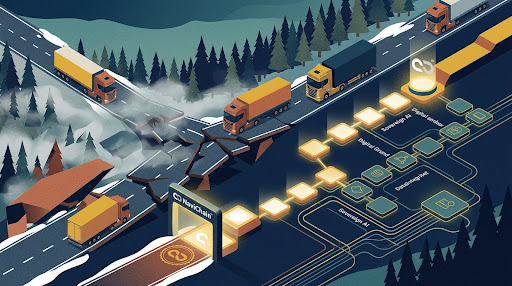
Fig 5: This white paper has outlined a strategic blueprint for SME hauliers to move from the 'Full Truck Fallacy' to a new model of 'Profit Visibility.' We have defined the three essential principles: a U...
This white paper has outlined a strategic blueprint for SME hauliers to move from the 'Full Truck Fallacy' to a new model of 'Profit Visibility.' We have defined the three essential principles: a Unified Operational Fabric, a Sovereign Data Architecture, and Embedded Analytic Intelligence. navichain SaaS is a platform designed from the ground up to embody this blueprint.
- Fulfilling the Unified Operational Fabric: navichain SaaS is not a collection of separate tools. It is a single, unified logistics operating system where Transportation Management (TMS), Warehouse Management (WMS), Asset Management, Billing Management, and Order Management work as one. This integrated core breaks down the data silos that create the Profitability Blind Spot, providing a single source of truth for your entire operation.
- Delivering a Sovereign Data Architecture: This is our core promise. Unlike mainstream cloud providers, the entire navichain SaaS platform is hosted on our own proprietary infrastructure in Sweden. Your data stays in Sweden, under Swedish jurisdiction. This guarantees full GDPR compliance and, critically, makes your data immune to foreign legislation like the US CLOUD Act. For our clients, data sovereignty isn't an add-on; it's the foundation.
- Providing Embedded Analytic Intelligence: Because your data is unified and secure on our Swedish infrastructure, our integrated AI can perform deep, secure analysis. This new feature runs within your sovereign environment, analyzing your unified operational data to unlock the true ROI metrics discussed in this paper—revealing your most profitable routes, customers, and assets. Our mission is to democratize logistics technology, empowering SMEs to increase efficiency, reduce costs, and deliver exceptional service. We believe the path to resilience is not just about filling trucks, but about building a secure, intelligent, and unified operation.
navichain SaaS empowers SMEs to move beyond the Full Truck Fallacy by providing a unified, sovereign, and intelligent logistics operating system.
References
- European Commission. (2020). EU transport in figures: Statistical pocketbook 2020. https://ec.europa.eu/transport/sites/transport/files/pocketbook2020.pdf
- International Road Transport Union (IRU). (2019). The Future of Trucking: Megatrends Shaping the Industry. https://www.iru.org/system/files/2019-09/IRU%20Future%20of%20Trucking%20Report%202019.pdf
- McKinsey & Company. (2023). The next frontier in transportation: Unlocking value through operational excellence. https://www.mckinsey.com/industries/travel-logistics-and-infrastructure/our-insights/the-next-frontier-in-transportation-unlocking-value-through-operational-excellence
- Gartner. (2022). Supply Chain Top 25 for 2022. https://www.gartner.com/en/newsroom/press-releases/2022-05-26-gartner-announces-ranking-of-the-2022-supply-chain-top-25
Navichain's platform offers enhanced visibility and control across the entire logistics network, improving efficiency and reducing risks.

Navichain's platform provides end-to-end supply chain visibility, enabling proactive decision-making and optimized performance.
Ready to optimise your supply chain?
navichain Insights Newsletter
Join the newsletter to receive the latest updates in your inbox.

