
The Profitable Haulier: How Automated Data Turns Red Numbers into Black
Table of Contents
Margins in the transport industry are merciless. But why do some hauliers manage to grow by double digits while others struggle to survive? In this Deep Dive, we reveal the difference. It’s not about the trucks – it’s about the data, and how you use it to stop invisible profit leaks.

We live in an era of "profit squeeze" unparalleled in modern transport history. According to reports from Transport Intelligence (Ti), Europe's leading logistics analysis firm, hauliers are being squeezed from two sides: costs are exploding due to fuel prices, wage inflation, and increased vehicle taxes, while revenues stagnate as freight buyers consolidate volumes and demand lower prices.
For many haulier owners, reality feels like a hamster wheel: running faster just to stand still. The traditional approach – working harder, driving more miles, and solving problems manually – no longer works in a digitized, globalized market. Scaling up an operation that leaks money on every mile only leads to faster bankruptcy.
However, there is a group of hauliers breaking the pattern. These "Profitable Hauliers" have stopped viewing administration as a cost and started seeing it as their primary revenue source. How? By automating data flow and letting truth – not gut feeling – guide every business decision. This article dives deep into how this transformation happens.
Fig 1: The "Silent Killers" eating up profits in traditional haulage operations.
Where Does the Profit Go? The Three Silent Leaks

Lost profits: Unaccounted delays and idle resources erode potential earnings in traditional haulage.
In a traditional haulier business, profit leakage is often invisible to the naked eye. It’s not a major catastrophe, like a crashed truck, but a thousand small cuts that collectively bleed out the operation's margin. Official statistics from Swedish Transport Analysis (Trafikanalys) show that profitability is often hampered by inefficiencies in these exact small moments.
1. Unbilled Waiting Time
This is perhaps the industry's biggest black hole. A driver arrives at a terminal. The dock is blocked. He waits 45 minutes. * In the old haulier: No one registers this. The driver might curse about it, but it doesn't end up on the invoice. The cost of downtime (driver wages + vehicle capital cost) is taken directly from the haulier's profit. * The Result: You are paying the customer for the privilege of standing at their loading dock.
2. Manual Inefficiency in the Tower
Look at your traffic management. According to studies from the IRU (International Road Transport Union), transport planners spend on average 20-30% of their day on "non-value-adding communication". This means calling drivers to ask "where are you?", chasing consignment notes, or manually keying order data from emails into the TMS. This is not just a waste of time – it is a direct brake on growth. If your traffic management is saturated with administration, you cannot take on more trucks without hiring more administrators, which eats up the margin on the new vehicles.
3. The Pricing Guessing Game
When a customer asks for a price on a specific route, how do you answer? Most hauliers look at what they charged last year, add a bit for indexation, and hope for the best. Or they look at what the competitor charges. This is dangerous. Without exact data on your costs – including the specific waiting time at that customer, and fuel consumption for that specific type of goods – there is a high risk that you win the contract but lose money on every delivery.
Fig 2: The difference in operating margin between manually managed and data-driven hauliers over 12 months.
Data as the Cure: From Intuition to Precision
The solution is not to "try harder" but to change system architecture. The profitable haulier uses technology to seal the leaks automatically. This requires a shift from active data collection (human reporting) to passive data collection (system recording).
The Power of Post-Calculation
The core of the profitable haulier is automated post-calculation. Instead of guessing what a shipment cost, the system knows it. Let's look at how such a calculation is built in real-time with a modern platform:
- Revenue: €450 (Fixed price per agreement).
- Cost (Driver): The app logs exact working time via Geofencing. 3 hours driving, 45 minutes waiting. Cost: €140.
- Cost (Vehicle): Telematics report exact fuel consumption for the route (32 liters) plus wear and tear based on mileage. Cost: €180.
- Cost (Overhead): The system automatically allocates a portion of fixed costs (rent, traffic management) to the order. Cost: €40.
- Actual Profit: €90 (20% margin).
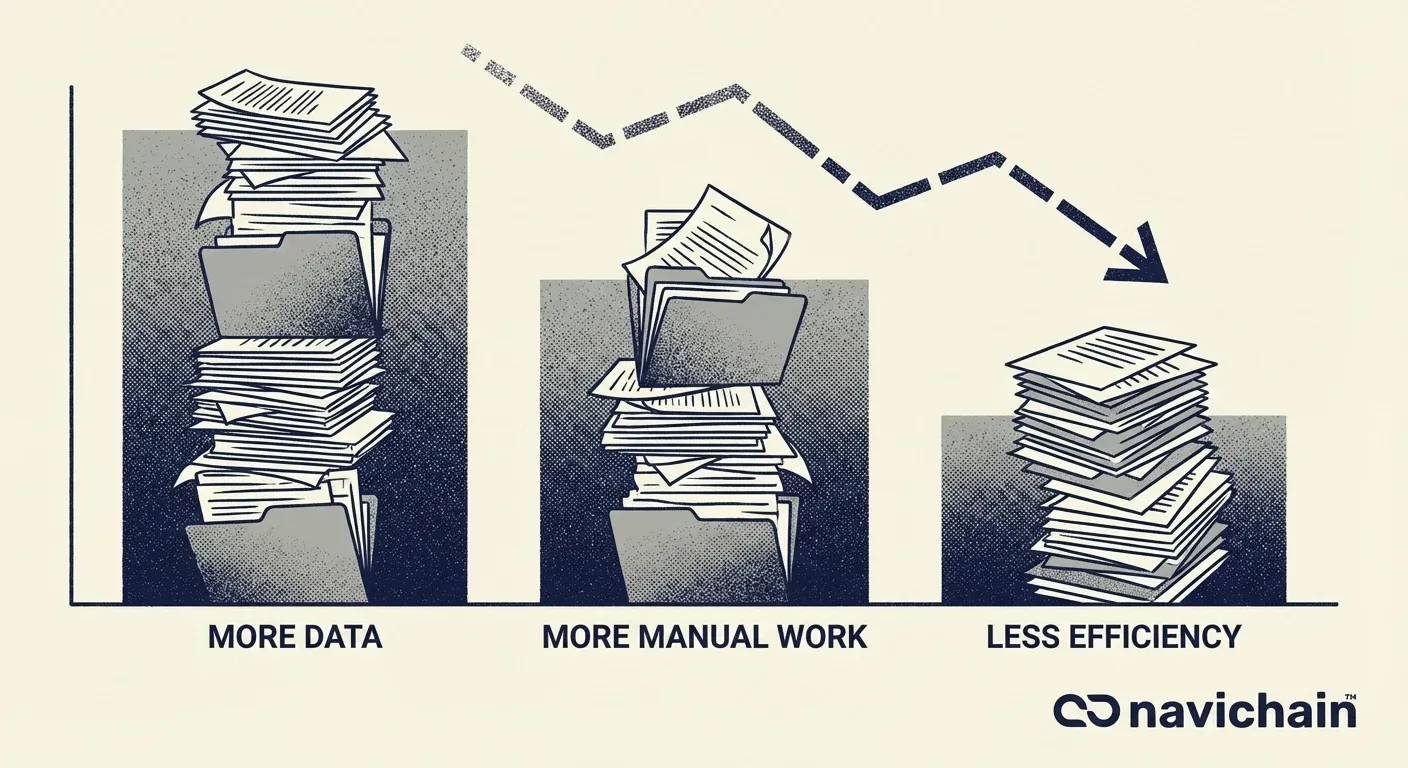
Illustration of real-time cost calculation, demonstrating how individual data points contribute to the final profit margin analysis.
But what if the waiting time had been 2 hours? Then the profit would have been wiped out. A modern system flags red immediately. You see patterns invisible to the eye: "Every Wednesday afternoon at the central terminal, we lose money due to queues." With this data, you can go to the customer and say: "We need to adjust the price or change the booking window. Here is the data showing why." This is not a negotiation; it is a presentation of facts.
Fig 3: The process of transforming raw data (GPS, Times, Fuel) into strategic decisions.
Navichain: The Engine of the Profitable Haulier
Building this infrastructure yourself – connecting GPS units, payroll systems, invoicing, and vehicle computers – is an IT project that can sink any medium-sized company. This is where Navichain comes in as a game-changer.
We have built Navichain as a SaaS platform (Software as a Service) specifically designed to eliminate manual work and deliver profitability insights "out of the box".
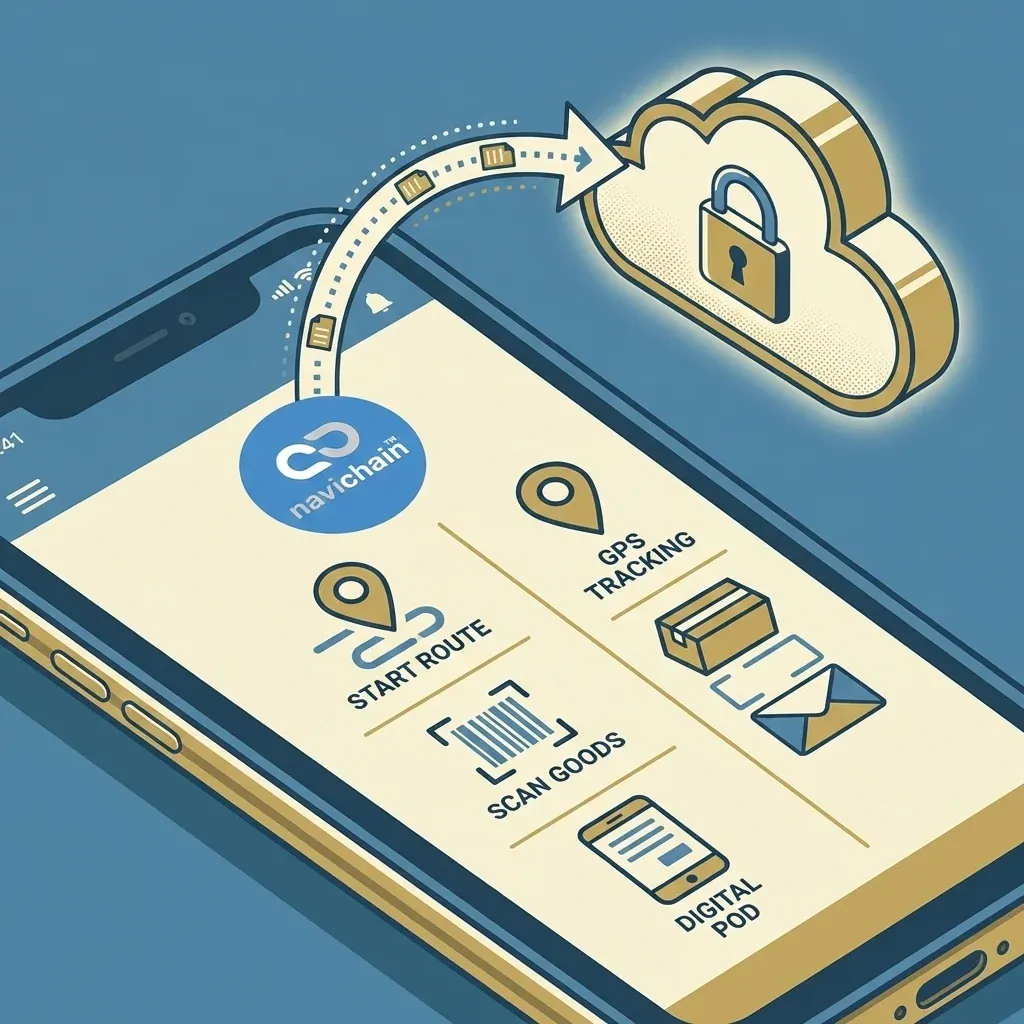
1. Passive Collection via the App
We have moved complexity from the driver to the cloud. Navichain's driver app is extremely simple. * When the driver enters a zone (Geofence) at the customer, the "Arrival" clock starts automatically. * When unloading is complete and the driver leaves, the clock stops. * Waiting time is now a fact, logged in the system, ready to be invoiced or analyzed. The driver didn't have to do anything.
2. The Unified Data Model
In Navichain, Order, Transport, and Invoice are the same object in different stages. There is no "gap" where information must be transferred manually. When a driver takes a picture of the goods (POD - Proof of Delivery), that image immediately becomes available as an attachment on the invoice. Administration time goes from days to seconds.
3. Strategic Security: Data Sovereignty
When your haulier business starts running on data, that data becomes your most valuable asset. Your prices, your customer registers, your margins – these are trade secrets. Storing this data in American cloud services (like AWS or Azure) poses a risk. Under the US CLOUD Act, US authorities have the right to request data from US providers, regardless of where in the world the servers are located. Read more about the risks at the Swedish Authority for Privacy Protection (IMY).
Navichain guarantees full Data Sovereignty. We host everything on our own infrastructure. Your business-critical data is protected by GDPR and local laws, out of reach of foreign interference. For the profitable haulier, this is a non-negotiable hygiene factor.
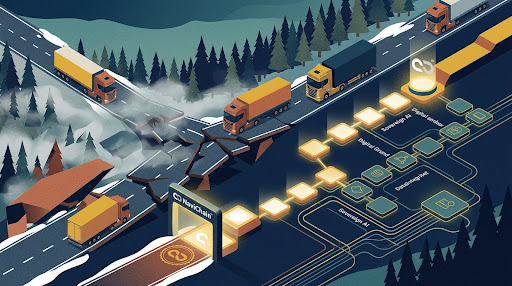
Fig 4: The result – a haulier scaling up sustainably with full control over margins.

A schematic illustrating how Navichain ensures data sovereignty by hosting data on its own infrastructure, protected by GDPR and local laws.
Summary: Three Steps to Turn the Numbers
Going from a traditional to a profitable, data-driven haulier is a journey, but the steps are clear:
- Stop the Leakage: Implement a system that captures all time and deviations automatically. Stop giving away waiting time for free.
- Analyze the Truth: Use post-calculations to identify which customers and routes are actually building your bank account, and which are draining it.
- Act Strategically: Use your data to renegotiate contracts, optimize routes, and, if necessary, phase out unprofitable collaborations.
Tools like Navichain are no longer "nice-to-have" for tech enthusiasts. In today's market, they are the difference between liquidation and evolution.
References and Further Reading
Here are the sources underlying the data in this article, along with recommended reading for deeper understanding.
- Transport Intelligence (Ti): "European Road Freight Market Reports". In-depth statistics on market trends. https://www.ti-insight.com
- Trafikanalys: "The Economic Development of the Haulage Industry". Official statistics. https://www.trafa.se
- IRU (International Road Transport Union): "Driver Shortage and Cost Indices". Global trends affecting local hauliers. https://www.iru.org
- Swedish Authority for Privacy Protection (IMY): "Third Country Transfers and the Cloud Act". Important information on where your data is stored. https://www.imy.se
- McKinsey & Company: "Digitizing the Supply Chain". Strategic reports on the future of logistics. https://www.mckinsey.com/industries/travel-logistics-and-infrastructure/our-insights

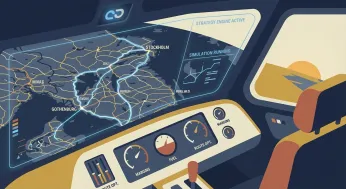
Data-driven insights empower hauliers to make informed decisions, optimize routes, and enhance overall profitability.
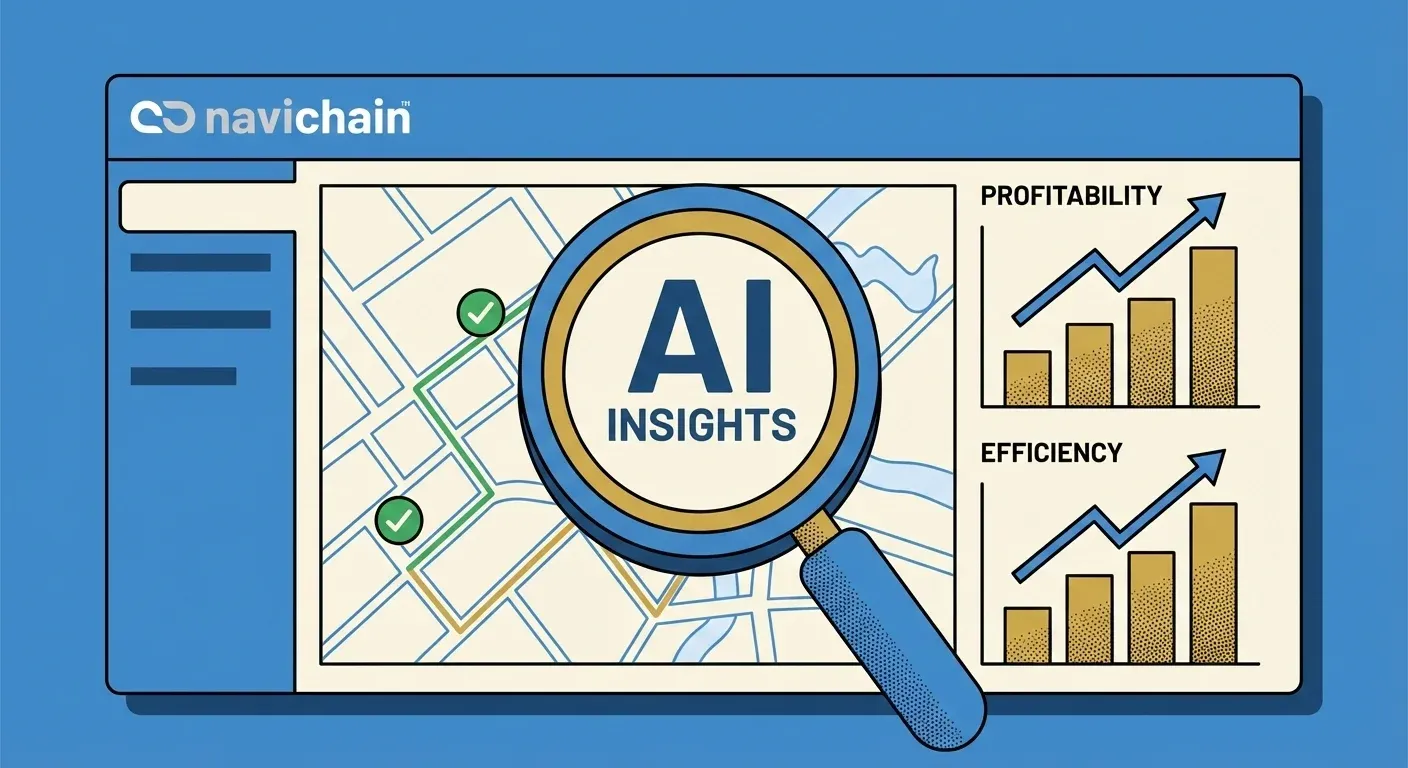
Navichain's interface provides a consolidated view of supply chain data, enabling informed decision-making and optimized logistics.
Ready to optimise your supply chain?
navichain Insights Newsletter
Join the newsletter to receive the latest updates in your inbox.
